The Hospital Price Transparency Rule mandates clear reporting of hospital charges, but recent changes may complicate data interpretation for users.
The rule has undergone recent revisions, which became effective in January 2026, with CMS emphasizing better guidance for encoding negotiated charges. One major focus is the necessity for hospitals to report rates as dollar values wherever feasible. While this isn’t a novel requirement, the new mandate that hospitals ensure all rates expressible in dollar amounts are encoded so strengthens the rule’s intent. Alongside, CMS introduced the “allowed amount” metric, which aims to provide deeper insights into median and percentile payment data. The expectation is that this detailed reporting will bolster price transparency and enhance the ability to compare negotiated agreements across various hospitals.
Implications of the New Provisions
Examining the implications of these recent changes, particularly the complexities in rate comparability, offers a clearer view of the landscape. Early assessments of HPT data, especially from sources like Turquoise Health, suggest some progression. For instance, the clearer reporting guidelines now in place streamlines how hospitals encode their pricing structures.
Nonetheless, the implementation of these guidelines reveals significant hurdles. For example, hospitals might encode both base and final rates as dollar amounts, which can mislead users regarding the true costs. If a hospital reports multiple rates under the same payer and plan combination, it can complicate the analysis, often masking a singular negotiated arrangement behind layers of data. Additionally, inconsistencies in how hospitals choose to encode algorithmic payment calculations versus detailed notes further muddy the waters, as there's no guarantee that this crucial data will be reported uniformly.
The User Perspective
The complexity of the HPT data presents stark challenges, particularly when differentiating the needs of various users. Market participants like hospitals and payers will likely engage deeply with the detailed aspects of the machine-readable files, leveraging this information for pricing strategies. They may also cross-reference claims data to contextualize their findings.
In contrast, researchers and app developers aiming to provide pricing transparency for consumers face steeper obstacles. They might sift through vast datasets but lack the capacity to digest all intricacies inherent in free-text elements, potentially leading to oversimplifications or inaccuracies in pricing reports for a broader audience. The new allowed amounts, intended to enhance understanding, often contain little to no useful data if a hospital hasn't received payments for specific procedures within the last year, making broad comparisons challenging.
While the recent updates to the HPT rule aim to enhance clarity and usability, the rollout will likely take time, and ongoing updates from CMS will be imperative to address emerging issues. As hospitals adjust to these requirements, the consistent application of the rule across various institutions remains uncertain.
Algorithm Dynamics and Reporting Challenges
A closer look at Table 2 reveals a nuanced picture when it comes to payment structures for MS-DRG 807 (Vaginal Delivery without Sterilization or D&C without CC/MCC) at Methodist Women’s Hospital in Omaha. While the algorithms surrounding these payment structures appear detailed and user-friendly—with the notable exception of the Aetna arrangement—the way payment terms are outlined can still pose challenges. Dollar amounts reported are base rates applicable for short stays of one or two days, with adjustments made for any additional days. For users to grasp the intricacies of these arrangements, they must sift through the free-text algorithm field or complementing payer notes data that aren't included in the main table. This task can be manageable for a handful of cases, but scaling it up to analyze larger datasets might feel daunting.
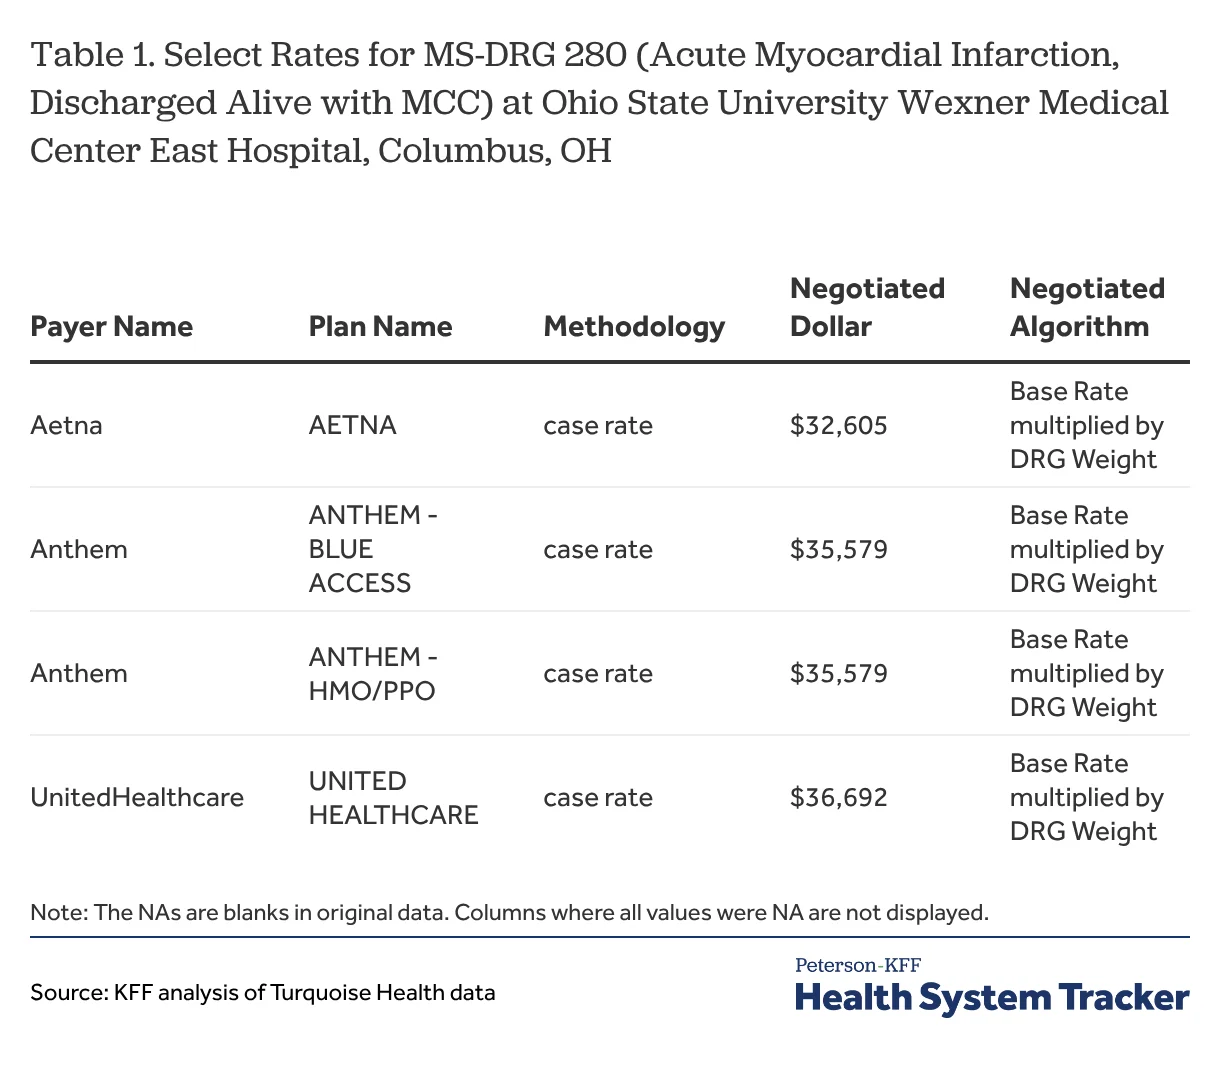
When comparing data from this table to information presented in Table 1, it’s striking how much larger the payment counts are in Table 2. This discrepancy can likely be attributed to a few factors. Firstly, childbirth rates are significantly higher than incidents of heart attacks in the commercial population. Secondly, the payment counts in Table 2 likely encompass payments from multiple related hospitals—similar rates and metrics appeared for the same payer combinations at another Methodist hospital locally. Diving deeper into the allowed amount counts, there's complexity due to a significant number being reported as zero or minimal. This raises questions about how consistently these counts are calculated, an issue that deserves more attention.
Deciphering Notes versus Algorithms
Another critical aspect to navigate is the inconsistency in how hospitals report negotiated algorithms compared to narrative notes. The additional notes data element—labeled as a free-text field—usually aims to clarify data intricacies, from charity care policies to contextual factors that enrich understanding of standard charges. However, some hospitals blur the lines by incorporating algorithmic content within these notes. This dual approach can mislead users, as notes might not just provide context but could explicitly describe formulas or conditions altering the reported rates.
These "Additional Generic Notes," highlighted in Table 3, imply that reported rates could be influenced by factors only identifiable in hindsight—like hospitalization duration or accumulated billed charges. Since these were reported as static case rates, users may unwittingly rely on flawed assumptions in their analyses. For instance, a per diem payment model might steeply diverge from the initially reported rate based on real-time variables like extended length of stay—a significant factor for anyone attempting to accurately forecast costs.
For data users and researchers, the necessity to dissect free-text notes complicates analysis severely, especially when processing large datasets. Unlike straightforward dollar amounts, free-text evaluations require a level of scrutiny that can be prohibitively labor-intensive. While the stakes may not be as high for industry participants analyzing a few arrangements, this added complexity can hinder broader understanding of how rates operate within the healthcare marketplace. Moreover, a prevalent issue is that hospitals often neglect to input information regarding allowed amounts in conjunction with their rates when using the notes format, limiting user access to vital statistical comparisons.
Navigating Outlier Provisions
Even with CMS's recent guidance, the encoding of stop loss and other outlier arrangements continues to perplex both hospitals and data users alike. The unpredictability of these payment structures—many adjust based on conditions that deviate from typical cases—means that hospitals might pay a premium when certain thresholds are crossed, like reaching specified billed amounts or extended stays. The complexity in these arrangements varies significantly; some might activate only under extreme financial circumstances, while others could trigger at more commonplace metrics.
Reporting practices vary from hospital to hospital, with some capturing these outlier provisions purely as algorithms, others as notes, and some opting for a hybrid methodology. Unpacking how these arrangements are reported is crucial, particularly given that some data sources, like Turquoise Health, currently do not include the optional general contract provisions data element. This lack of consistent practice leads to further confusion—users could miss important details that significantly impact payment structures.
Despite the new CMS recommendations, room for ambiguity remains. The guidance attempts to clarify when to encode these provisions as general contract terms versus algorithmic formats, but it doesn't decisively tackle the finer aspects of these distinctions. This leaves users grappling with whether arrangements that apply to multiple services warrant algorithmic categorization. Additionally, there’s a need for caution about how integrated outlier provisions are reported, especially when they overlap with broader algorithms.
As the industry moves forward, it's clear that getting these terms right can significantly affect how payment mechanisms are interpreted and utilized. Each adjustment in reporting could yield substantial implications for data analysis practices, requiring both hospitals and users to remain vigilant and adaptable to ensure clarity and accuracy in rate reporting.
Decoding Reporting Practices in Hospital Payment Rates
The nuances of how hospitals present payment rates can be deceptively complex. Typically, a hospital’s billing can include an initial flat fee for a patient's first days of care, followed by daily charges. However, a troubling trend emerges when examining how hospitals disclose these rates. Many institutions, like the one cited in Table 5, report a blended approach, specifying both a case rate and a per diem fee but failing to align with the Centers for Medicare & Medicaid Services (CMS) directives. According to CMS guidance, such arrangements should be represented as a single line item through the negotiated algorithm data element, making it easier for data consumers to understand payment structures.
Take a closer look at Table 3, featuring UnitedHealthcare rates. Instead of portraying the comprehensive picture in one clear line, they split the information, leaving critical details isolated in notes. This lack of adherence to CMS guidelines means the rates could be interpreted without the crucial context of allowed amounts, potentially skewing analyses. For professionals navigating this data, the resulting patterns can be particularly hard to detect, especially when juggling hefty datasets.
Ambiguity Among Reported Rates
What's noteworthy is that hospitals are frequently reporting more than one rate for the same payer arrangement. They might present both a fee schedule rate and an algorithmic rate without any negotiation amounts, which complicates the landscape further. For example, the issues highlighted by Table 6 emphasize that without clarity on whether these figures reflect different agreements or payment methodologies, users are left to make sense of conflicting information.
To the untrained eye, it’s easy to overlook these discrepancies. Many might default to using fee schedule rates simply because they are readily available as dollar amounts. However, relying solely on these could be misleading; as evidenced in the tables, actual payments can deviate significantly from these values.
Interpreting the Allowed Amount Count
Another challenge arises with the allowed amount count element, which often registers a surprising zero. This can point to a troubling reality: hospitals frequently report that no payments were received for specific billing codes over the past year. Analyzing a widespread schema across 6,445 hospitals revealed that overwhelmingly, 92% of instances for negotiated algorithms and 95% for negotiated percentages showed a zero count. That leaves data users in a lurch, especially if they often anchor their analyses to these counts. If these figures represent hospitals that have not engaged in any transactions, then how reliable are the provided fee schedules?
Table 8, which focuses on MS-DRGs 280 and 807, further underlines the concern, with zero counts still hovering around 72% and 91% for the respective algorithms and percentages. High instances of zero values suggest an even broader question about the efficacy of the available information. Do these rates serve any analytical purpose when they lack corresponding payment data?
As we sift through these findings, professionals need to remain vigilant about the potential pitfalls of using reported values that have little backing. In an era where data is king, ensuring accuracy and clarity becomes paramount. Researchers and analysts diving into these datasets will need to tread carefully, as drawing insights from incomplete or misleading information risks inflating the perceived financial realities of hospital reimbursements. Ultimately, the road ahead will likely require clearer guidelines and enforcement from CMS to help unravel this complicated web of healthcare billing.

Discussion
Sign in to join the discussion.